The current near-record level profit margins of
the S&P 500 are largely an illusion, created solely by the fact that
interest costs have fallen precipitously, even as overall debt levels have
increased. Operating profitability, is
actually below average. As the Fed’s
Quantitative Easing program is unwound, earnings are at significant risk
Current profit margins for S&P 500 companies remain near historic highs even as the broader economy struggles and real income growth remains anemic. The stock market trades near record levels supported, if not by fundamentals, by promises of the Fed to hold interest rates near historic lows. Today though, the certainty of those promises is being discussed with potentially very negative consequences for US and Foreign Markets.
Market bulls point to high profitability and supportive
market action as well as benign valuation as reason for their continued
positive stance. Indeed, market
participants are by many measures, as bullish as ever (hedge fund net longs,
investor sentiment measures).
Bulls will counter that we have witnessed a permanent shift upward in margins given the now global nature of production and the ability of corporations to manage costs better than ever by using offshore operations when beneficial. This same argument is often cited when explaining why US personal income growth remains anemic. While on the surface this is a believable narrative, the data does not back it up.
- · operational factors (sales less the direct costs of production)
- · tax factors (the percentage of sales one forfeits in taxes)
- · financing factors (amounts paid due to corporate financing decisions), and
- · extra-ordinary items (one-off items, not likely to be recurring in nature)
Current net margins are quite high by historical standards
(8.04% versus the 15-year average 6.55%).
However, “operational margins” (the profitability of a company apart
from their taxes and financing decisions) are now actually below average – so
much for the benefits of global production.
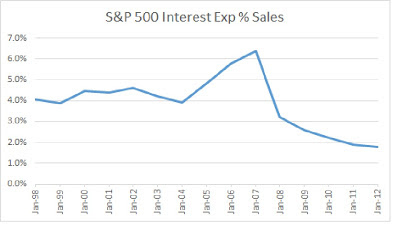
The reason for the discrepancy between margins as generally discussed
and operational factors has to do with the very low level of interest expense
(1.78% of S&P 500 sales compared to an average of 3.88%), even though
overall leverage (debt as % assets) has risen to 14.2% from the long-term
average of 11.5% (Averages use year-end figures calculated from Dec 1998 through
Dec 2012).
The charts which follow demonstrate this dynamic
quite clearly. After a bump during the
period 2005 – 2007, interest expenses have fallen dramatically in spite of the
fact that debt levels climbed (most precipitously in 2009). To measure leverage, I have chosen to show both Total Debt to Asset as well
as Net Debt to Asset measures. It is my belief
that net debt better hints at corporate vulnerability to leverage as it takes
into account “tactical” debt issuance where retained cash can, theoretically,
be used to immediately reduce leverage should borrowing costs reverse).
The chart below shows “operational margin” levels since 1998. Current readings are slightly below average. Should interest costs rise and encroach on overall business profitability, it is net margins that will have to suffer disproportionately.
Sources for all exhibits: Brett Gallagher, Zack’s Investment Research
Two conclusions can be drawn from the above. First, given the low level of interest rates, further progress in margin enhancement via lowering interest expense without paying down debt would seem limited and operational metrics must improve if current margins are to be sustained.
Secondly, should rates reverse their downward trend,
interest costs could have the opposite effect on profitability as financing
costs rise dramatically. If interest
expenses revert to their historic average, net margins would fall below 6% (all
else equal, this results in a 25% earnings decline from today’s levels).
IN CONCLUSION, assuming continued sluggishness in economic
(and, hence sales) growth, high levels of leverage and a bottoming of interest
rates, maintaining margins above the norm is unlikely and reversion to mean
becomes a more likely outcome than a secularly higher level of profitability. In such an environment, earnings are
vulnerable as are P/E multiples, meaning equities themselves are at risk.
In the next two postings to this blog, I will provide long-term
return assumptions for US, UK, Continental European and Japanese equities
(under a range of margin and P/E assumptions) as well as a variety of government
and corporate bond markets using a proven valuation methodology. The results will have significant
implications for plan sponsors and other investors.


