While
equity markets have more "moving pieces" than their fixed income
counterparts, their longer-term outcomes can likewise be broken down into a
handful of understandable and forecastable components. When approached in this
disciplined manner, we see that returns from nearly every major equity region in the coming
decade will be poor, with the UK faring better than most and the US
likely to struggle.
It is a given that there are only
two ways to make money from an equity - either you are paid a stream of
dividends, or the price another party is willing to pay you for your shares
differs from the price you paid (Dividend + Price Change). In general,
the Dividend component is readily observable and tends to be less volatile
while stock Price Changes are more volatile and, in the short-run, more
unpredictable.
To better understand the portion of
return due to Price Change, we can further decompose that piece into Earnings
Growth per share and the P/E Ratio (i.e. the price one is willing to pay for
each dollar's worth of those earnings). Both are somewhat volatile, but
less so than the overall Price Change itself. To simplify further, I
sub-divide the Earnings Growth component into Revenue Growth and the change in
the profitability of those Revenues (i.e. the Profit Margin). Taking all
this together then, if we know with near certainty just four variables:
Dividends, Revenue Growth, Profit Margins and the P/E Ratio, we know with certainty
the return from an equity (or equity index).

Fortunately, for the purpose of our
analysis, two of these components are relatively stable over a period as long
as a decade (Dividend Yield and Revenue Growth), while valuation and
profitability are more volatile -- and it is this change in the P/E Ratio and
Margins that ultimately drives returns. Thus a sensitivity analysis
featuring these two unknowns is called for.
Some Background
Equity earnings tend to be cyclical
over time (see chart) and gauging market value on a single, spot observation
can be mis-leading -- especially when earnings are well above, or well below,
their trend. As of June 30th, the P/E Ratio on trailing, reported earnings of
the S&P 500 index was 18.2x, just above the longer-term norm of 17.1x
(the median valuation since Dec 1959). One might therefore conclude
that the market is slightly overvalued. What is left out of such a simplistic
analysis is that the earnings part of that calculation is not at its norm, but
rather closer to a cyclical high.

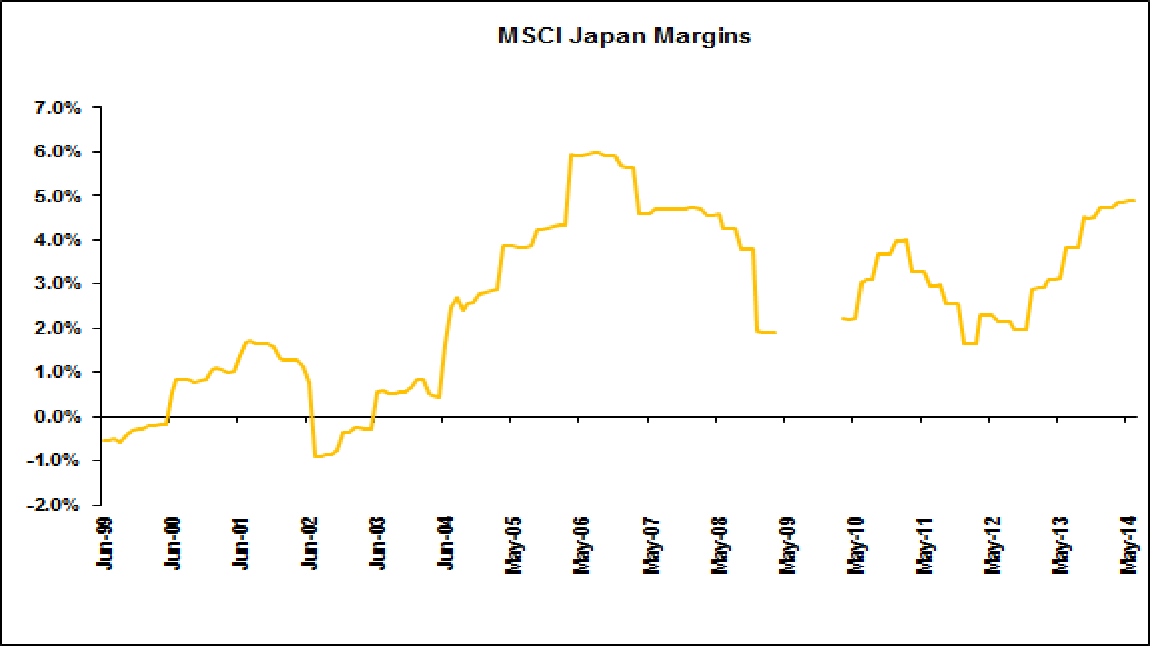
Instances such as this occur
when margins are historically high, even as they are understood to be
generally mean-reverting. Today, margins in the US and Japan are closer
to one of these cyclical peaks, while those in the UK and Europe are
not.



Thus, a valuation analysis which
adjusts for the margin's deviation from its norm and which assumes dividend
growth in line with earnings (as long as the current payout ratio is near
longer-term norms), revenue growth in line with historical trends (typically
that of nominal GDP) and a valuation component (P/E ratio) that returns to its
long-run median over a period of ten-years should provide a decent assessment
of where returns are headed as cycles run their course. Those who
disagree with my assumptions of a return to normal margin can use the
accompanying sensitivity tables and observe returns under a range of margin and
P/E inputs - but refer to the above charts to understand what is in the
"normal" (i.e. likely) range of outcomes. I would direct
doubters back to "The Profitability Illusion" (posted to this blog
June 15, 2013) which discusses in some detail why
over 2 percentage points of the current S&P 500 margin is illusory and
unlikely to be sustained (all due to lower interest expense as opposed to better operational efficiency). In any case, the range of returns can be
illuminating and the dispersion of returns, not as wide as one might assume.
I turn first to the United States and use the
S&P 500 index as a proxy for US Equities. Over the past 50+ years, a
median valuation of 17.1x earnings is the norm (I choose to use a median as
opposed to an average because out-sized values can distort its calculation.
In full disclosure, the average P/E has been 17.6x). Margins have
averaged 6% for the past 50 years and have proven throughout to be mean
reverting. Today, though they stand near record highs of over 8% and in
this analysis it is assumed they will slowly return to the 6% average.
For this exercise, we also assume
5.5% annual compounded nominal revenue growth (in line with historic norms) and
a 2.08% annual return from dividends (normalized current yield). Putting this
all together, our best guess return estimate for US Equities over the next 10
years is 2.0% per year. If you want to assume record margins continue,
you could up that expectation, but just to 5.0% (see table below). Under
no reasonable scenario, are double digit equity returns in sight.
S&P 500 10-Year Return Estimation (5.5% Nominal Revenue Growth, 2.08% Annual Dividend, Various Margin and P/E Scenarios
| Normalized PE Ratio | ||||||
| 2.0% | 13 | 15 | 17 | 19 | 21 | |
| Normalized Margin | 4.0% | -4.5% | -3.1% | -1.9% | -0.9% | 0.1% |
| 5.0% | -2.4% | -1.0% | 0.2% | 1.3% | 2.3% | |
| 6.0% | -0.6% | 0.8% | 2.0% | 3.2% | 4.2% | |
| 7.0% | 0.9% | 2.3% | 3.6% | 4.7% | 5.8% | |
| 8.0% | 2.2% | 3.7% | 5.0% | 6.1% | 7.2% | |
Taking Japan next we conduct a
similar analysis, using the historically lower 3.0% margin levels and 3.0%
nominal revenue growth. Though Japanese valuation data is distorted
somewhat by 10+ years of a great bubble, we feel a normalized P/E ratio of
20.x, higher than that of the US, can be argued, though we show a range of
12.5x to 27.5x in the sensitivity below. Still, a 3.0% return is the most
likely annual outcome for the coming decade.
MSCI Japan 10-Year Return Estimation (3.0% Nominal Revenue Growth, 1.77% Annual Dividend, Various Margin and P/E Scenarios
| Normalized PE Ratio | ||||||
| 3.0% | 12.5 | 15.0 | 20.0 | 25.0 | 27.5 | |
| Normalized Margin | 2.0% | -5.4% | -3.7% | -1.0% | 1.2% | 2.2% |
| 2.5% | -3.3% | -1.6% | 1.2% | 3.5% | 4.4% | |
| 3.0% | -1.6% | 0.2% | 3.0% | 5.3% | 6.3% | |
| 3.5% | -0.1% | 1.7% | 4.6% | 6.9% | 7.9% | |
| 4.0% | 1.2% | 3.0% | 6.0% | 8.3% | 9.4% | |
Moving on to the European markets
and the UK, we reach a somewhat happier, though still below historic,
level of return expectations. For the UK market we use similar
revenue (5.5%) and normalized margin assumptions (6.0%) as we do for the US.
For the continent, I discount both revenue growth and margins by 0.5%, in
line with historic observations. Again, under a broad range of valuation
and margin assumptions we see a most likely return for the UK of 5.7% and a
most likely return of 3.9% for the continent.
MSCI UK 10-Year Return Estimation (5.5% Nominal Revenue Growth, 3.95% Annual Dividend, Various Margin and P/E Scenarios)
| Normalized PE Ratio | ||||||
| 5.5% | 10 | 12 | 14 | 16 | 18 | |
| Normalized Margin | 4.0% | -1.7% | 0.1% | 1.6% | 2.9% | 4.1% |
| 5.0% | 0.5% | 2.3% | 3.8% | 5.2% | 6.4% | |
| 6.0% | 2.3% | 4.1% | 5.7% | 7.1% | 8.3% | |
| 7.0% | 3.8% | 5.7% | 7.3% | 8.7% | 10.0% | |
| 8.0% | 5.2% | 7.1% | 8.7% | 10.1% | 11.4% | |
MSCI Europe ex UK 10-Year Return Estimation (5.0% Nominal Revenue Growth, 3.71% Annual Dividend, Various Margin and P/E Scenarios)
| Normalized PE Ratio | ||||||
| 4.0% | 10 | 12 | 14 | 16 | 18 | |
| Normalized Margin | 3.5% | -3.8% | -2.1% | -0.6% | 0.7% | 1.9% |
| 4.5% | -1.4% | 0.3% | 1.9% | 3.2% | 4.4% | |
| 5.5% | 0.5% | 2.3% | 3.9% | 5.3% | 6.5% | |
| 6.5% | 2.2% | 4.0% | 5.6% | 7.0% | 8.2% | |
| 7.5% | 3.6% | 5.5% | 7.1% | 8.5% | 9.7% | |
CONCLUSION
It is almost certain that returns from the major
developed equity markets are quite likely to remain in single digits - from somewhere
near 2.0% compounded in the US to under 6% compounded in the UK – for the
decade ahead. This realization, combined with similar fixed income expectations
is that most plan sponsors will have great difficulty achieving their projected
return assumptions of over 7.5%, even under the most optimistic of market
conditions
Obviously a new perspective on
managing and allocating funds is called for. This is why my July blog post, “The Task of Capital Allocators” is so important for every Plan Sponsor to consider.


